4.5.5.2. Add-on data
IRM supports a generic mechanism for showing non-IRM, file-based data in the IRM Web Client. This is very useful for cases where you want to be able to conveniently see some additional data in IRM without transferring ownership of that data into IRM - one can imagine this as a temporary attachment of data.
IRM supports an integration with Fiber SenSys devices, via the Fiber SenSys Integration Service (FSIS).
The scenario supported by this integration is as follows:
-
The user creates an IRM Equipment object that represents a Fiber SenSys sensor in IRM. This object is given a name that matches the name of the sensor in step 2.
-
A physical Fiber SenSys sensor is installed. Something triggers the sensor, which generates a Fiber SenSys Alarm, Fault, or Tamper event.
-
Alternatively, the Fiber SenSys SDK sensor simulator is used to create a simulated sensor (with a name matching the IRM sensor object in step 1) and then generate an Alarm/Fault/Tamper on that sensor.
-
The Alarm/Fault/Tamper is received by the FSIS.
-
The FSIS uses the name of the alarmed device to find the sensor Equipment object and set its add-on data to match the sensor's current state (with the alarm activated)
-
The FSIS creates an IRM Alert object. The Alert contains a reference to the IRM Equipment object for the sensor and has the appropriate priority set.
-
The FSIS had earlier (at startup time) created an AlertSource object with some default OutputAction(s). An Admin user may modify the list of OutputActions, but in any case there is some list of them in the AlertSource
-
IRM runs the appropriate Actions for the Alert. The exact list depends on the AlertSource and Alert priority.
The add-on data can be viewed under a dedicated tab inside the object's Properties dialog - the Add-on Data tab. For the scenario described above, the addon data is visible inside the Equipment Properties dialog:
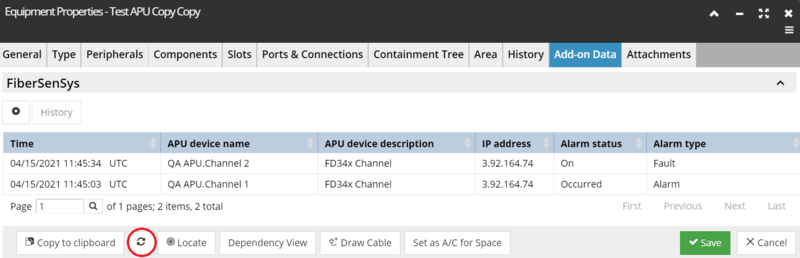
Generally, the Add-on Data tab is very similar for all objects in IRM that supports Add-on data. The tab displays a separate data grid for each add-on data source, inside a accordion control that can be expanded/collapsed. The example screenshot above displays the FiberSenSys add-on data, listed into a data grid, displaying basic properties such as column data, the date/time stamp of the data creation, the name, description and the IP address of the device, Alarm status and type, and finally, the timeout for the Alarm in miliseconds.