4.3.10.5. Pathway Utilization and Loading
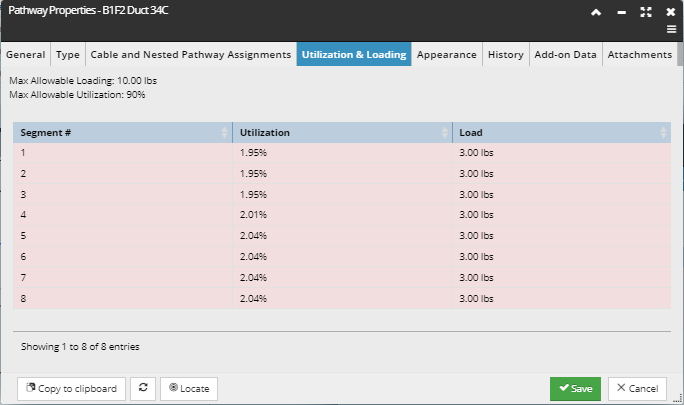
In addition to showing the per-segment Pathway loading in the Design World, the same information is available in a data grid in the "Utilization & Loading" tab in the Pathway Properties dialog:

The grid shows the following information in column data:
-
Segment number
-
Utilization, displayed as a percentage
-
Load, displayed in Pounds or Kilograms, depending on the User Setting for Weight
Additionally, the following key related fields are displayed above the grid, which display the maximum allowable loading and utilization values.
Notice the rows in the data grid displayed in the screenshot is highlighted in red background color, indicating those rows have the Critical Load Point and Critical Utilization Point values.
In addition to weight load, the data grid also displays space utilization - it is displayed to the user in the Design World via a separate menu item:
Two additional related properties are displayed: critical Load Point and critical Utilization Point - these are simply the Load Points that have the greatest values for load and utilization. These two Points are often at the same x,y location but might possibly be at different locations.
For example, when a Cable is added or removed to/from the Pathway, if and only if it goes through either of these Load Points, the load and utilization values are incrementally updated.
The Critical Load Point and Critical Utilization Point are used to be shown with a "locate" type operation, via dedicated Pathway context menu items "Show point of greatest load" and "Show point of highest utilization":