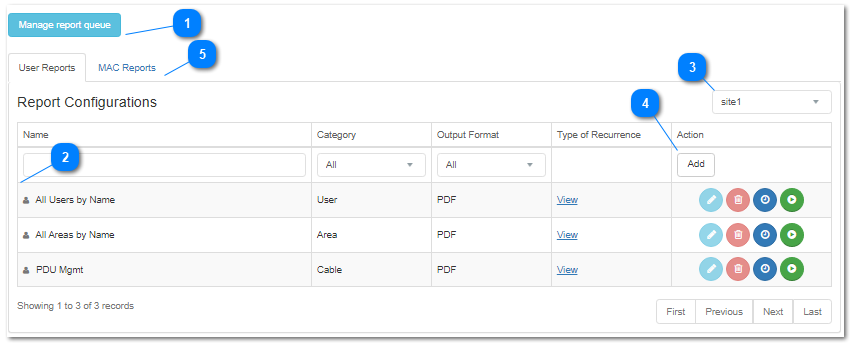
4.1.3.1. Report Configurations
The following is a breakdown of the Report Configurations data grid and all its additional features and conveniences.
Important: Note that for many parts, this page shows content very similar to the Reporting dialog in the Site Master. For this reason, for some parts of this feature we will provide links to the appropriate topic for Site Master.
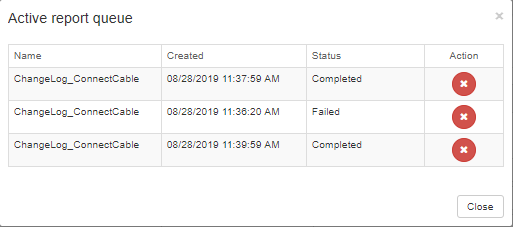
 Manage report queue buttonOpens the Active report queue dialog:
The grid lists all actively running Report Configurations by their Name, also displaying their Status (Completed, Running, Queued), Time of Creation and Action button for removing individual Configurations.
A Report Configuration is added to this list in two cases:
-
it is scheduled for running at the time the Active report queue dialog is opened -
it is set to run from the Report configurations grid by clicking the Run action button (explained more in the next step).
The report at the top of the list will run first and additional ones are added below, essentially like a standard OS print queue.
|
 Report Configuration data grid detailsThis data grid lists all Report Configurations for the selected Site, along with their basic properties and additional action buttons.
For each report configuration the following column data is displayed:
-
Report Configuration Name - defined at the time of creation.
-
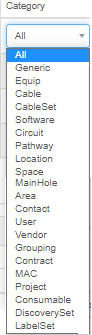
Category - the Super Category of Report Files.
-
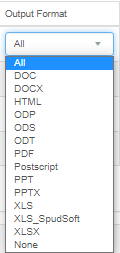
Output Format - one of the supported Report File output formats (DOC, DOCX, HTML, ODP, ODS, ODT, PDF, Postscript, PPT, PPTX, XLS, XLS_SpudSoft, XLSX).
-
Type of Recurrence - the type of scheduling set for the Report Configuration (Once, Hourly, Daily, Weekly, Monthly, , Yearly by date, Yearly by week of month, etc.)
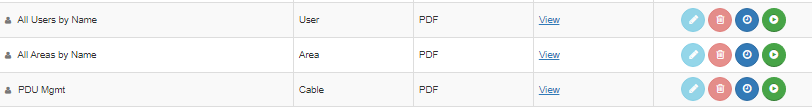
The following action buttons are available for each row entry in the Report configurations grid:
 - opens the Report Configuration dialog. Public configurations can be edited by everybody. Private configurations can be edited if owned by a current user or by Admins.  - Remove Report Configuration entry. enabled if owned by a current user or for Admins.  - Opens the Scheduled Job Configuration sub-dialog - explained in detail under dedicated iiPDF Exports subtopic - Job Scheduling - Opens the Active report queue dialog and adds the selected Report Configuration to the bottom of the list of Active reports |
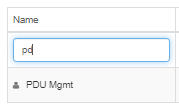
 Data grid filtersBy default, the top grid lists all Report Configurations among all Sites, for all object types and for all supported output file formats. Over time, this list gets populated with a large amount of data and potentially may get difficult to browse through. To avoid this, the user can filter out the data via several convenience features.
The easiest way to search for desired Configuration is directly by it's name, which is enabled by typing the Configuration name directly in the text field above the Name column:
Another way of filtering the data is by using different drop-down menus, such as the Site drop-down menu on the top-right side of the dialog, just above the data grid:
Additionally, the Category and Output Format columns have the same capability:
|
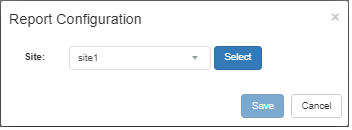
 Add new Report ConfigurationThis button opens a pop-out dialog for selecting a Site as a first step of creating a new Report Configuration:
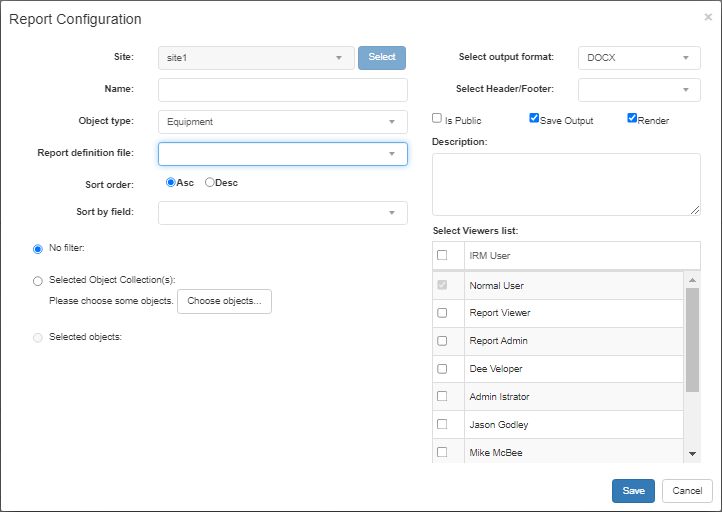
Next, click on the Select button expands the initial dialog enabling the user to specify the rest of the Report Configuration properties:
Note: The properties specified within this dialog are explained in detail within the coverage of the Site Master Reporting Configuration feature, so please refer to that section for more details.
|
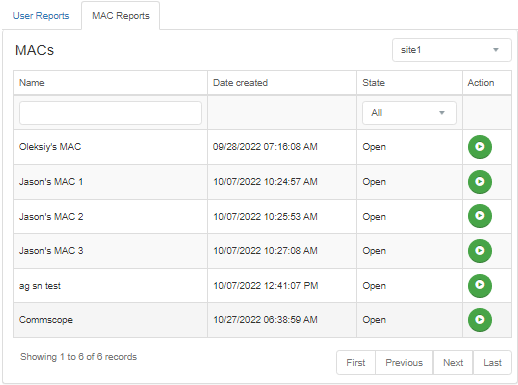
 MAC Reports tabIn addition to the user-defined Report Configurations, there is a dedicated tab menu that displays the same data grid, but only for MAC-generated Report Configurations.
As seen from the screenshot image above, the grid lists Report Configurations for the MAC Super Category by their Name, along with their basic properties, such as creation date and State displayed as column data.
Similarly as for the general Report Configurations, column data can be filtered:
-
by Site, selecting it from the drop-down menu on the top-right of the data grid -
by Configuration Name, entering it directly in the text search box under the Name column -
by State, selecting it from the drop-down menu under the State column
Finally, the Run Now Action button also adds the selected MAC Report Configuration to the Active report queue.
|
|