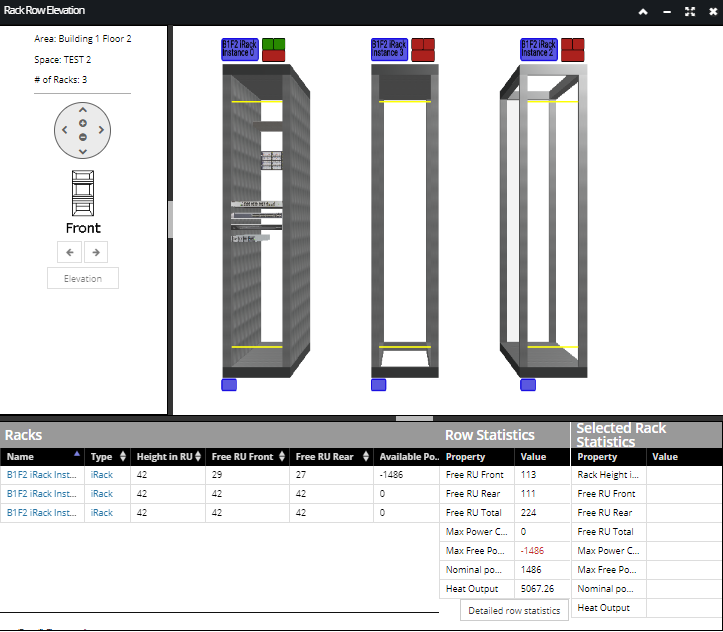
The Row Elevation dialog is somewhat similar to the Elevation Dialog in the way it displays graphical models of Racks and basic data about them, including any contained Equipment. Instead of showing a single Rack, however, it shows an entire row of selected Racks. A row is nominally a set of Racks in which every Rack in the row is within a certain distance of one or two other Racks in the set or is based upon the racks selected by the user in the Design World.
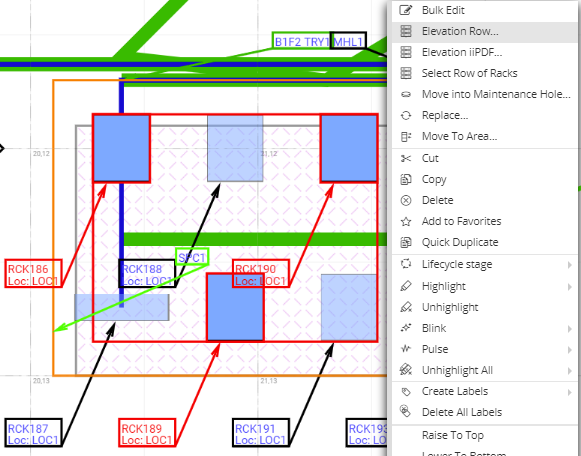
The dialog can be accessed by selecting the Elevation Row... context menu option after selecting multiple Rack instances in the Design World or Object Grid. The screenshot image below shows an example of Racks in Design World, arranged in two rows of three Racks, with three of the Racks selected for display the Row Elevation diagram:
Even though the Racks selected for Row Elevation are not physically in a linear arrangement, the visual output in the Row Elevation is arranges them in a linear arrangement, for clarity and convenience:
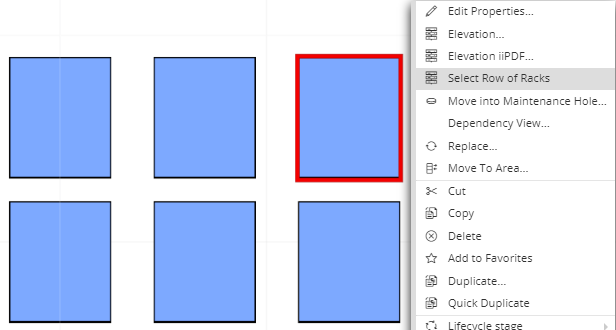
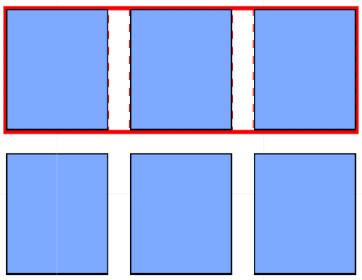
To make it easy to select an actual row of racks, IRM provides the Select Row of Racks context menu option available whenever a single Rack is selected in the Design World.
This option selects all adjacent (or nearly adjacent) racks that have the same orientation as the initially selected Rack. Note that currently, the selection only works for the Racks that are oriented horizontally or vertically in the Design World, not those oriented at some arbitrary angle.
Like the Elevation dialog, the Row Elevation dialog has three main elements:
-
-
an Equipment list panel ( Racks), -
a Selected Rack Statistics panel
and also a left side information panel.
The following is an explanation of these main dialog parts in more detail.
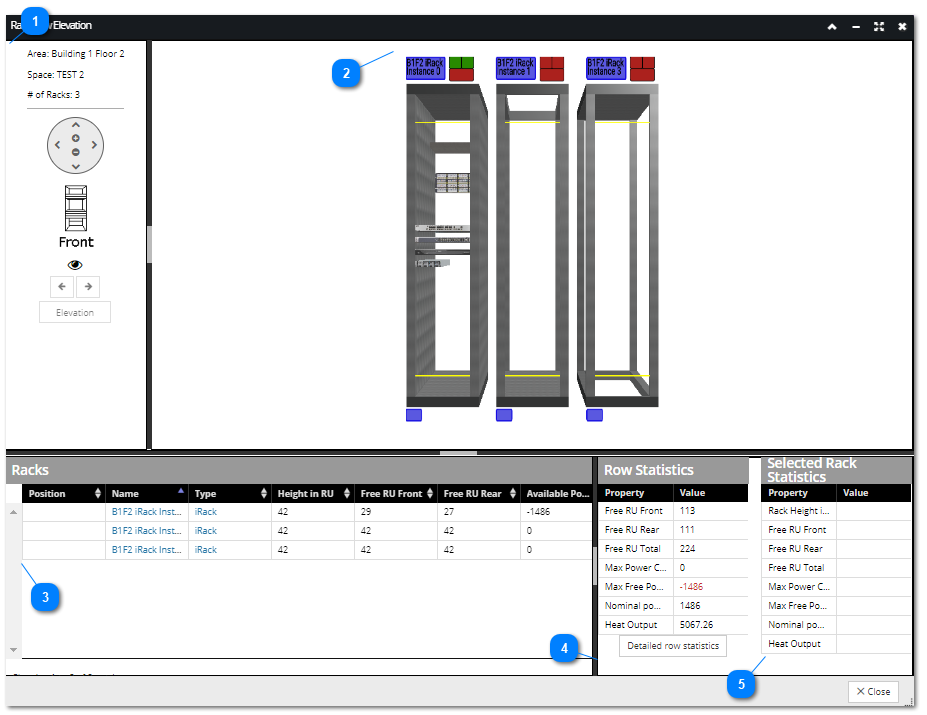
 Left information panelThe leftmost panel consists of the following parts:
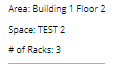 - a read-only section that displays basic information, including the Area name, Space Name and the number of Racks displayed currently in the Row Elevation dialog.
 - the same Pan & Zoom control as found in the Elevation 3D view. Note that the left/right arrows cause the view to "orbit" the row; the path around the Racks is a rounded rectangle if viewed from above, while the up/down arrows just pan the current view up or down.
 - Front / Back / Top / Middle / Bottom buttons that function the same as in the Elevation dialog. The Front and Back buttons are enabled by default, while the other three buttons that are part of the Rack icon (Top, Middle and Bottom) are enabled only upon Rack selection.
 - click on the Toggle Chassis Transparency (Eye) toggle button makes the side, top, and bottom panels partially transparent, like an "x-ray view".
 - Left / Right arrows are enabled only when a Rack is selected; they change both the view by moving the view one rack left / right and also the currently selected rack.
 - Elevation button opens the Elevation dialog for the selected Rack and is disabled if there is no selection. |
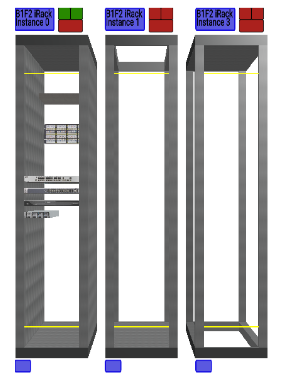
 Central graphical panelThe central graphical panel contains 3D cuboid models of the selected Racks, very similar to the 3D presentation of the Racks in the Elevation dialog. The main purpose of this central panel is to select, view and visually explore each Rack by zooming and rotating the 3D view.
The Rack model shows accurate front and rear textures for all Equipment in the Racks, as well as Slot Equipment, such as cards and modules. However, unlike the Elevation dialog, it does not show individual Port or Slot statuses.
Note: for large collection of Racks showing at the same time it might take minutes to load all Slots and contained Equipment.
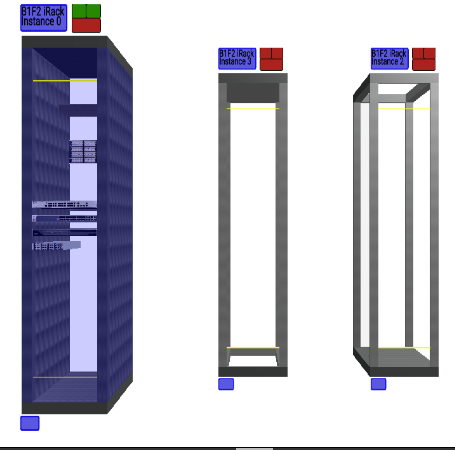
As mentioned in the previous point, in this dialog the selection works on a Rack basis, not on an Equipment basis like in the Elevation dialog. By default no Rack is selected when the dialog is first entered, but once a Rack is selected, it is moved forward (which makes it appear larger) and shown with a color highlight:
When a Rack is selected, the corresponding item in the Racks table is also selected.
In addition, a pair of rectangle colorized icons are displayed above each Rack:
-
the left one is the same as the standard Design World Label, displaying Rack Name, -
the second one consists of three (two top and one bottom) rectangles, indicating RU utilization in the front and back (top pair of rectangles) and the total power utilization (bottom rectangle) with appropriate colors. Red indicates full, yellow indicates close to full and green indicates a low space or power utilization. This enables the user to be able to tell at a glance which racks have plenty of remaining capacity (all rectangles green) vs. racks with some capacity remaining (all rectangles yellow) vs. racks that are fully utilized (all rectangles red).
|
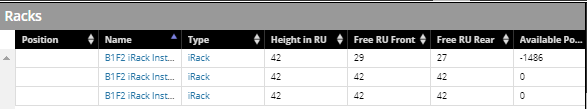
 Racks panelThe Racks panel contains a simple grid that lists all Racks displayed in the Row Elevation dialog, with additional basic properties for each, like the Position of the Rack in the row, the Name of the Rack, and the Rack Type and other Rack statistics. Clicking on the name of a Rack or Rack Type opens the Rack Properties or the Equipment Type Properties dialog for that item.
|
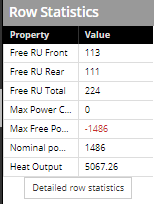
 Row Statistics panelThe Row Statistics panel contains a data grid displaying summary information for the currently viewed row of Racks, like the free RU space, power consumption, etc. Note that these statistics are very similar to the ones displayed in the Statistics panel in the Elevation dialog, but here the data is calculated for the entire row of Racks.
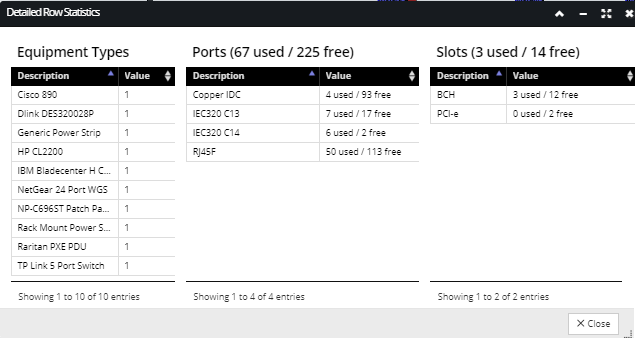
The Detailed row statistics button opens a sub-dialog with additional statistical data, such as the number of all different Equipment Types, Ports and Slots contained in a row of Racks. An example of such dialog can be seen in the screenshot image below, with all different types of containment:
|
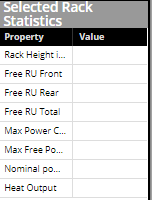
 Selected Rack Statistics panelThis data grid contains information for the currently selected Rack. It displays basic Rack properties, like its dimensions in RU, free RU space, power consumption, etc. Note that this is the same data as displayed in the Statistics panel in the Elevation dialog.
|
|