The Analytic Manager is one of many convenience features in IRM. It enables the user to specify a stylized view for a specific Category of objects that can be drawn in Design World. The target objects get drawn differently when the conditions specified in the Analytic hold. This enables the user to create a "visual filter" for certain objects or to make some objects stand out in some way. This functionality is meant to complement other IRM features, such as searches, filters, and Layers, that are also used to help find or identify specific objects.
The following features are enabled by the Analytics Manager:
specify an Analytic for different super categories
create a new Analytic
set and edit Analytic parameters
set analytics to private/public
apply (activate) analytics
duplicate analytics
remove analytics
view Conditions for a particular Analytics
create Conditions
set Condition parameters
edit Condition
remove Condition
cancel analytic
The following screenshot displays a use case example of creating an Analytics in order to visually distinguish Equipment that has no available (free / non-connected) Ports inside an existing Design World area. This operation is done primarily in the Analytics Manager dialog, which is accessed through the drop-down menu from Design World, as described in the first step of the example.
The following screenshot(s) and text explain the example in more detail.
Open Analytics Manager
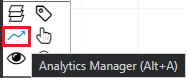
To access the Analytics Manager, click on the arrow icon in the middle section of the Design World toolbox.
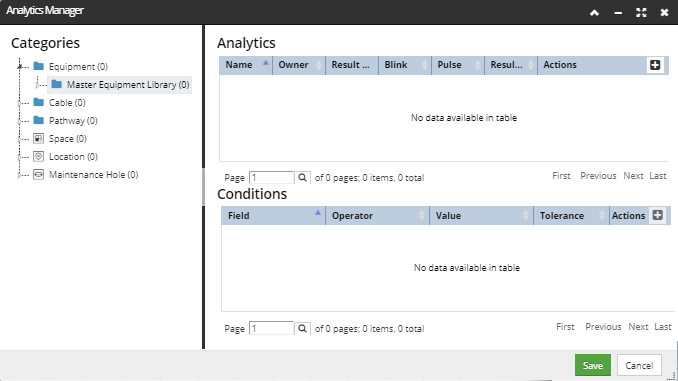
The Analytics Manager dialog is a simple dialog and is similar to other Manager dialogs throughout the application.
The left side of the dialog shows the Categories tree menu, very similar to the C&T tree in the main application screen, but displaying only Super Categories and Categories and only for the objects that can be drawn in the Design World (Equipment, Cables, Pathways, Space, Location and Maintenance Holes). The Analytics Manager enables the user to specify Analytics for different Super Categories; furthermore, it enables specifying different Analytics for each Category inside the selected Super Category. Another specific feature of this Categories tree is that, along with the name of the Super Category, it displays the number of existing analytics in parenthesis. In this example, there are no previously created Analytics, so 0 value is displayed next to each Super Category name.
The rest of the dialog contains 2 grids: Analytics and Conditions, which are displayed as empty by default, but populate with Analytic data once a Super Category that actually has an Analytic specified is selected in the Categories tree (see step 5 for more detailed information).
Since the goal of this use case is to create a new Analytic for all Equipment currently displayed in the currently opened Area in the Design World (Building 1 - Floor 2), the appropriate Category is selected (in this example the Master Equipment Category), which automatically enables the + button in the top (Analytic) grid. Clicking on it opens a new dialog -- the Analytic Editor -- which enables the Analytic to be defined. See the next step for more details.
There are 2 cases a user can enter the Analytic Editor from the Analytics Manager dialog:
when specifying a new Analytic, clicking on the + button in the Analytic grid header (like in our example),
or when editing an existing Analytic, clicking on the pencil action button in the Analytic grid header.
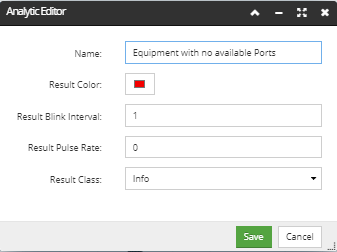
The Analytic Editor dialog enables specifying the following parameters:
Analytic Name - the name of the new Analytic, by default set to "<User Name> Analytic", but is editable. In our example the name is specified to be as much descriptive as possible i.e. Equipment with no available Ports.
If the Analytic triggers for an object, the following values specify how to visually represent (draw) the object in the Design World:
Result Color - the color of the resulting object view with the applied Analytic. Since in our example we want to easily view all Equipment instances with no available Ports for connection, the selected color is red.
Result blink interval - rate of the blinking effect applied on the drawn object, the value is in ms/blink. The default value is set to 0, which effectively means no blinking will be applied to the drawn object. Since in our example we want the resulting Equipment instances easily viewed, we set this value to 1, so the resulting Equipment is blinking.
Result pulse rate - similarly as above, the rate of the pulsing effect applied on the drawn object, the value is in ms/blink. The default value is set to 0, which effectively means no pulsing will be applied to the drawn object, as in our example. Since in our example we already applied the blinking effect, there is no need to apply this effect as well, so we'll leave this value at its default (0).
Result class - one of the following pre-defined values: Info, Error, Warning. This class is for descriptive purposes, specified to group similar Analytics into classes for easier filtering. For our example, this value is set to Warning, which is appropriate for our use case.
The specified values can be either saved or discarded by clicking on the appropriate button on the bottom of the dialog, which then closes the Analytic Editor dialog and brings focus back to the Analytics Manager dialog. In our example, the newly created Analytic is automatically displayed in the Analytic grid, but with no Conditions set. In order to complete the Analytic specification, Conditions need to be specified for that Analytic, which is done in a separate sub-dialog, as described in the next step.
Once a new Analytic is created it's automatically displayed in the Analytic grid, but with no Conditions set. In order to complete the Analytic specification, Conditions need to be specified. That is done by selecting the newly created Analytic and clicking on the appropriate row in the Analytic grid, which enables the + button in the top-right part of the Conditions grid. This opens the Analytic Condition Editor sub-dialog, which enables specifying the condition which, if met, will display the target Category (Sample Equipment) objects in the specified Resulting Color, Blinking / Pulsing Rate and Class.
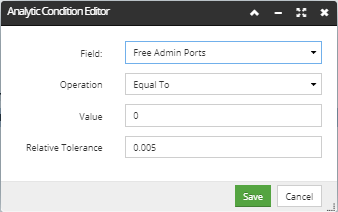
The following parameters can be specified for the Analytic condition:
Field - one of the fields of the selected object class. In our example, since we want to visually distinguish Equipment with no available ports for connection, the selected value here is the # of free ports field.
Operation - the comparison operator for the condition, which is one of the following values: Equal To, Less Than, or Greater Than. In our example, the selected Operation is Equal To, as we want the targeted Equipment objects have exactly 0 Ports available. Another combination of the Operation and Value could also be applied for our example, like Less Than and 1.
Value - the value of the selected condition Field that has to be present for the object to satisfy the Analytic. As mentioned above, in our example, the selected Value is 0, as we want the targeted Equipment objects have exactly 0 Ports available.
The specified values can be either saved or discarded by clicking on the appropriate button on the bottom of the dialog, which then closes the Analytic Condition Editor dialog and brings focus back to the Analytics Manager dialog. In our example, the newly created Condition is not automatically displayed in the Conditions grid, but is displayed once the appropriate Analytic row entry is selected. The reason for this is because it is possible to specify multiple Conditions for a single Analytic, which is convenient when specifying more complex conditions.
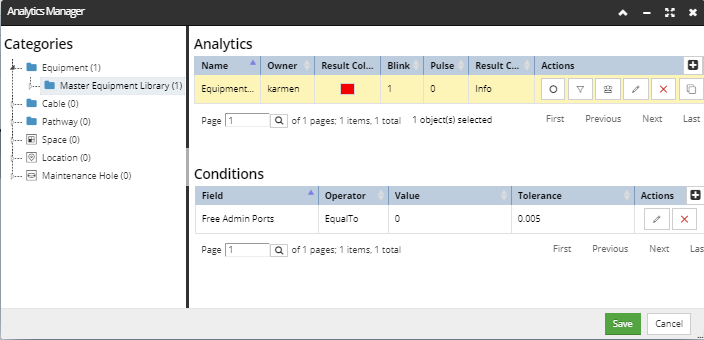
Once the Analytic and Condition parameters are specified and saved, they are displayed in the main Analytics Manager dialog as row entries in the appropriate grids. As mentioned in the previous step, the Conditions grid is populated once the appropriate Analytic row entry is selected, as displayed in the screenshot for our example.
From this dialog, the following actions are enabled for the Analytic grid:
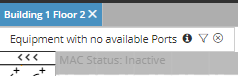
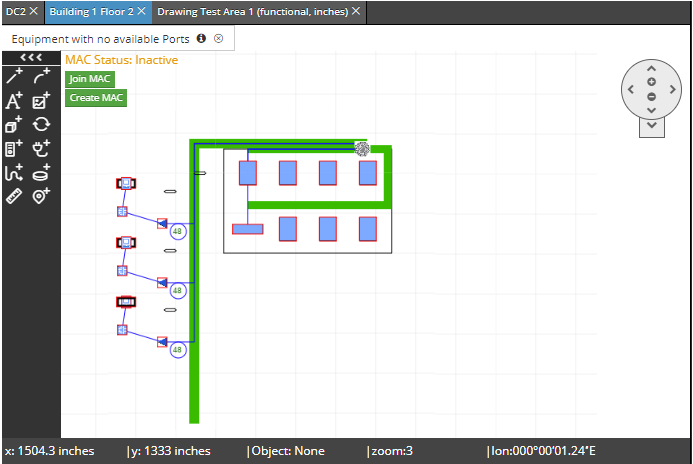
- to directly apply the Analytic to the current Design World view without saving the changes in the Analytics Manager dialog, click on the check Action icon. This action creates a small tag in the upper-left corner of the Design World screen:
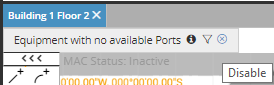
Upon click, the Action icon in the Analytics Manager changes its appearance , while another click on it disables the active Analytic. Another way to disable it is by clicking on the x icon in the Design World tag:
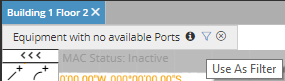
- to directly apply the Analytic as a filter to the Object Grid and get a direct list of objects that meet the Analytic's conditions, click on the funnel Action icon, or the small filter icon in the Analytic tag (in the upper-left corner of the Design World):
Applied filter is also indicated with an appropriate tag right above the Object Grid -
- to toggle Analytic's sharing setting to private or public, click on the user Action icon
- to edit the Analytic in the Analytic Editor sub-dialog (point 3) click on the pencil Action icon
- to remove the Analytic, click on the x Action icon
- to duplicate the Analytic, click on the clone Action icon. This creates a duplicated analytic that is automatically renamed (adding numeration or "clone" text to the duplicated entry).
The following actions are enabled for the Conditions grid, assuming the appropriate Analytic row entry is selected:
to edit a Condition, click on the pencil Action icon, which opens the Analytic Condition Editor sub-dialog
Once the Apply Analytic button is clicked, the Analytic from the selected row entry is automatically applied to the current Design World view. As specified and visible from the screenshot above, the Equipment objects that have no available Ports are displayed with a red solid border and appear blinking. The applied Analytic is also indicated with a small text label displayed in the top left corner of the Design World. To cancel the applied Analytic, click on the x button next to the Analytic's name in that label.